Microsoft announced that ExpressRoute monitor is now GA! This is great news for all enterprises utilizing ExpressRoute, since there was no easy way to do this before.
ExpressRoute monitoring with Network Performance Monitor (NPM) is now generally available
The ExpressRoute monitor is based in Network Performance monitor (a solution in OMS) that Microsoft adds more and more value to. I thought I would dwelve a bit on the node part of the ExpressRoute monitoring.
The internals of the monitoring works with nodes on selected networks on-premise and in Azure sending packages to one another over port 8084 TCP (or port of your own choosing). Each hop on the way between your on-premise location and Azure are noted as one hop and nicely illustrated on your topology map

To get working nodes, you will need to install OMS agent on each node you want to have in your monitoring. I would recommend at least two at each network location, so a single node failure will not generate false-positives in your monitoring, however you will be fine with one.
Example setup
- Virtual Network in WestEurope
- Two virtual machines, preferably running 24/7 with OMS agent configured to the NPM workspace
- 8084 port opened in guest-firewall and NSG or Appliance firewalls that traffic has to traverse to get to the ExpressRoute
- On-premise datacentre in Berlin
- Two servers (virtual or physical), preferably running 24/7 with OMS agent configured to the NPM workspace
- 8084 port opened in guest-firewall and firewalls that traffic has to traverse to get to the ExpressRoute
After the installation and registration, it usually takes a few minutes before popping up in your NPM. Under NPM –> Configuration, your nodes are located. Here you can add a location comment and check “Use for monitoring” for all the nodes you want to utilize in your ExpressRoute monitoring.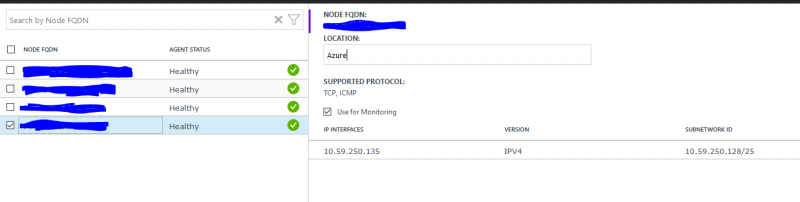 Note: If the OMS agent are not able to traverse with TCP 8084, only ICMP will been seen under Supported Protocol.
After adding nodes, go to Networks under configuration. By default each node will add it own subnet and get placed in default. So for example if Berlin node is in 192.168.10.0/24, that network will be added in default – hence to make it clearar we can set label on the networks. We can here choose a “Add Network”, and give a better network name, for example Berlin. Repeat for each network you have. Do not forget to press Save (happend to a friend…)
When done, we go back to NPM and choose Topology Dashboard and when we choose our nonde, we will get the network name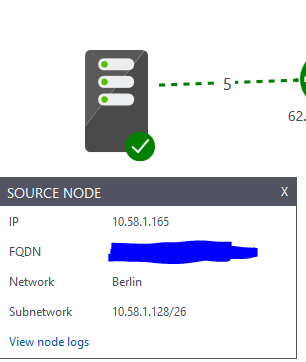
We can further divide our network into subnetworks, in case you have several networks on the same location, to make it even more granular.